 Catalogo de metadatos del IGME
Web Map Service WMS
Type of resources
Available actions
Topics
Provided by
Years
Formats
Representation types
Update frequencies
status
Scale
-
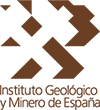
The map shows a probabilistic identification of rockfall source areas for El Hierro Island, prepared with the combination of multiple statistical models. To run the models, we have used observed source areas as dependent variable and a set of thematic information as independent variables (e.g., morphometric parameters derived from the DTM, lithological information that considers the mechanical behaviour of the rocks).
-
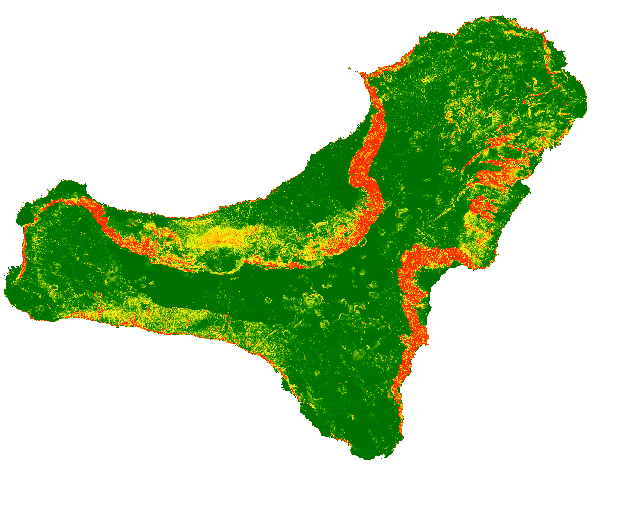
The map show the number of trajectories that pass through each pixel.
-
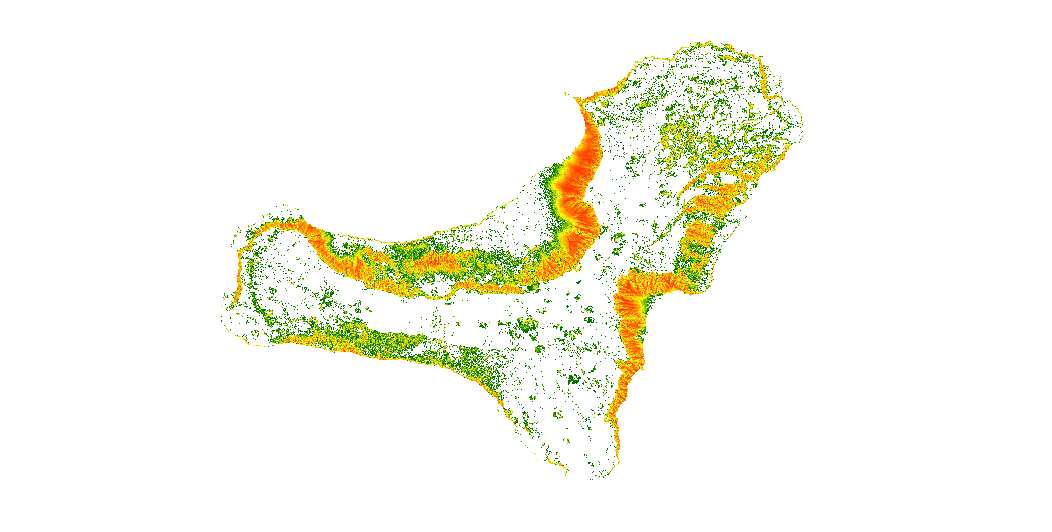
ZESIS is a database of seismogenic zones of the Iberian Peninsula and territories of influence developed for the calculation of the update of the seismic hazard map of Spain (IGN-UPM, 2013). ZESIS is the result of the evolution of three successive models in which numerous researchers from national and international research centres have collaborated, and of the synergy of the FASEGEO (CGL2009-09726), SHARE (FP7-226967), IBERFAULT (CGL2009-07388), OPPEL (IGN-UPM) and SISMOGEN (IGME) projects
-
Geophysical database available in the IGME corresponding to the following methodologies: Electrical (SEV, SEDT and Electrical Profiles), Testification, Gravimetry, Petrophysics, Airborne (flight lines and meshes), Electomagnetic (MT) and Seismic (seismic lines and sections seismic, TIF and SEG-Y).
-
The Tectonic Map of the Iberian Peninsula and Balearic Islands has been made according to the guidelines given by the elaboration of the International Tectonic Map of Europe in the 1960s. The principles of representation adopted in this map have a double purpose: to differentiate the major structural elements of the earth's crust, and to record the earth's dynamics in the past. Map of the geographical distribution of the large structural units of the Iberian Peninsula and the Balearic Islands classified into two large groups: platform areas and orogens, from which three units have been derived: Hercynian Mountains, Alpine Mountains and Platform, Mesozoic and Tertiary areas. The cartographic units represented have been delimited based on their temporal relationships with the age of deformation, in the case of the Cordilleras. The structural relations between the units are reflected by the trace of the large folding structures and the faults. The different degrees of metamorphism to which the different rock groups have been subjected are also included.
-
Mining heritage map of Galicia, at a scale of 1:400.000, in which, on a simplified geological basis on a simplified geological base, a selection of points considered to be of mining heritage interest in Galicia has been represented.
-
Database of sterile deposits and coarse materials poured dry (mine tailings) that originate in the mines and quarries. Contains the National Inventory of Mining Tailings and Structures of Mixed Type with information related to physical and geological characteristics, type of mining, impact on the environment, possibility of exploitation, etc. This information has been obtained through the completion of the National Inventory of Mining Ponds and Minig Tainlings from the IGME from 1983 to 1989. It is a georeferenced factual database managed with SQL Server.
-
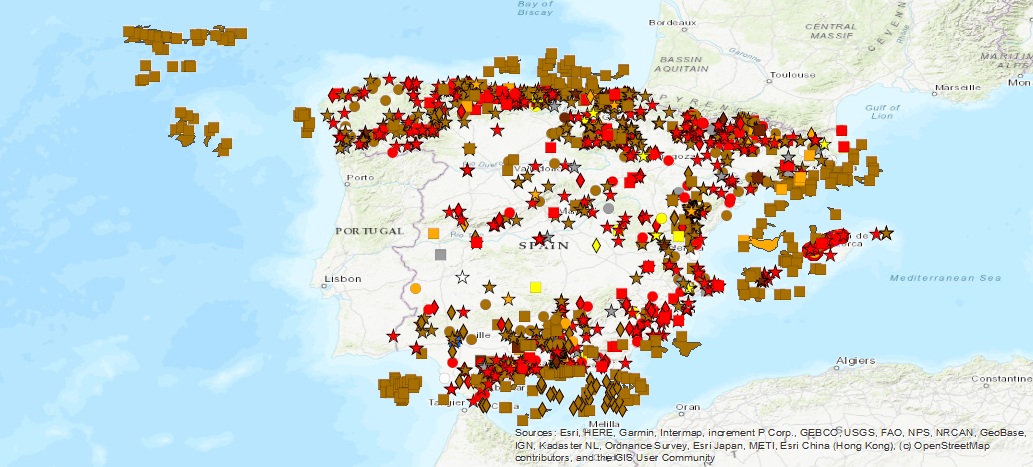
Spanish national inventory of land movements. Includes land movements of gravitational geological origin affecting Spanish territory, such as landslide movements: landslides, landslides, flows, etc., vertical movements: subsidies, collapses, expansiveness and underwater landslides. It does not include movements of tectonic origin such as those produced by earthquakes or continental drift or of volcanic origin. BD-MOVES is structured in two blocks or sets of georeferenced spatial information: the one referring to the description of the intrinsic and relatively invariable characteristics of the movement of the terrain and the one referring to the different activity events that produced these movements, including morphometry, triggering factors and damages, among other data.
-
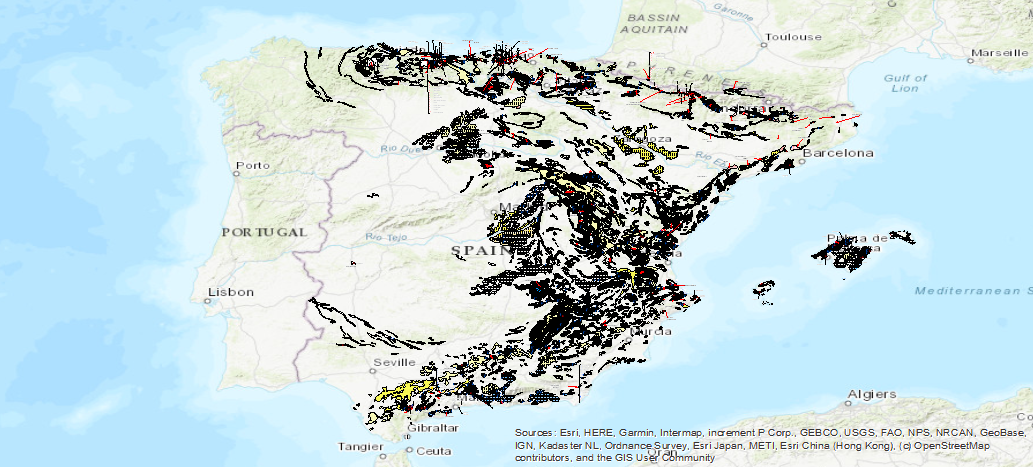
The Map of the Karst of Spain includes the different 'karstifiable' lithologies indicating their type (carbonates, gypsums and detritus), and the intensity of karstification in each of the areas. Also included are caves, poles, outcrops and other hydrogeological and geomorphological entities linked to karstification processes
-
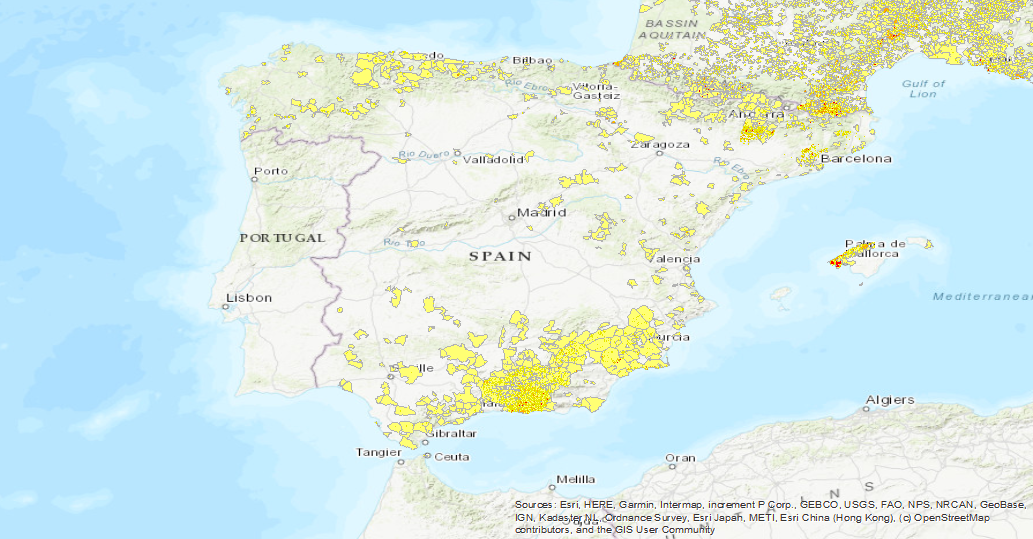
The first layer is a Landslide density map (LANDEN). The second layer is an average landslide density for each administrative area. A detailed explanation of these layers can be found in: Herrera, G., Mateos, R. M., García-Davalillo, J. C., Grandjean, G., Poyiadji, E., Maftei, R., ... and Trigila, A. (2017). Landslide databases in the Geological Surveys of Europe. Landslides, 1-21.https://doi.org/10.1007/s10346-017-0902-z.